Live
While the primary intention is use a database for all layers, Gisaf has the capability to display layers directly from GeoPandas GeodataFrames.
In this case, they can also be updated dynamically, adding animation capabilities to the maps.
This can be used for, eg:
- displaying text (eg. temperatures, well levels)
- moving elements
- results of computations and analysis...
Using live directly from a Python script on the Gisaf server
Eg:
#!/usr/bin/env python
from asyncio import run

import geopandas as gpd

from shapely.geometry import Point

from gisaf.live import live_server

async def run(gs):
    gdf = gpd.GeoDataFrame(
        data={
            'geometry': [
                Point(12.01, 79.81)
            ]
        },
        crs='epsg:4326'
    )

    await live_server.publish_gdf('FooLayer', gdf)

async def main():
    await live_server.create_connections()
    await run(gs)

if __name__ == '__main__':
    run(main())
Explanations:
1. Initialize the connection with live_server.create_connections().
2. Publish a geo dataframe with live_server.publish_gdf('name of the layer', gdf)
This mode of operation is well adapted for live updates, when the script can be controlled by systemd or similar OS service control tool.
From Jupyter notebooks
Quite similarly to the case above, jupyter notebooks (running on a different machine) can be used to publish and control live layers through an HTTP POST API (at http:///api/live/my_channel_name), which is multipart (the layer definition in the first part, the data in the second).
from gisaf.ipynb_tools import Gisaf
gs = Gisaf()
async_run(gs.to_live_layer(my_channel_name, my_gdf))
In other words, from the example above using directly Gisaf code, the only difference is the replacement of await live_server.publish_gdf(... by async_run(gs.to_live_layer(....
See the examples in Templates/gisaf_live_templates of the avgs jupyter notebooks.
Styling
The live layers can be styled with Mapbox (see https://www.mapbox.com/mapbox-gl-js/style-spec#types-layout).
Eg:
await live_server.publish_gdf(
    'FooLayer',
    gdf,
    mapbox_layout={
        'text-line-height': 1,
        'text-padding': 0,
        'text-allow-overlap': True,
        'text-field': '\ue005',
        'icon-optional': True,
        'text-font': ['GisafSymbols'],
        'text-size': 32,
    },
    mapbox_paint={
        'text-color': 'green'
    }
)
Data driven styling
One can leverage the power of Mapbox's data driven styling (using properties for each feature):
1. Define one or more columns in the dataframe with a property to be used for styling (eg. color, text, etc)
2. Pass the list of property columns to be given to mapbox with the properties parameter of publish_gdf.
Eg:
await live_server.publish_gdf(
        gdf,
        'my_live_layer',
        mapbox_layout={
            "text-field": "{text}",
            "text-font": ["Noto Sans Regular"],
            "text-offset": [0, 0],
            "text-anchor": "center",
        },
        properties=['text']
    ))
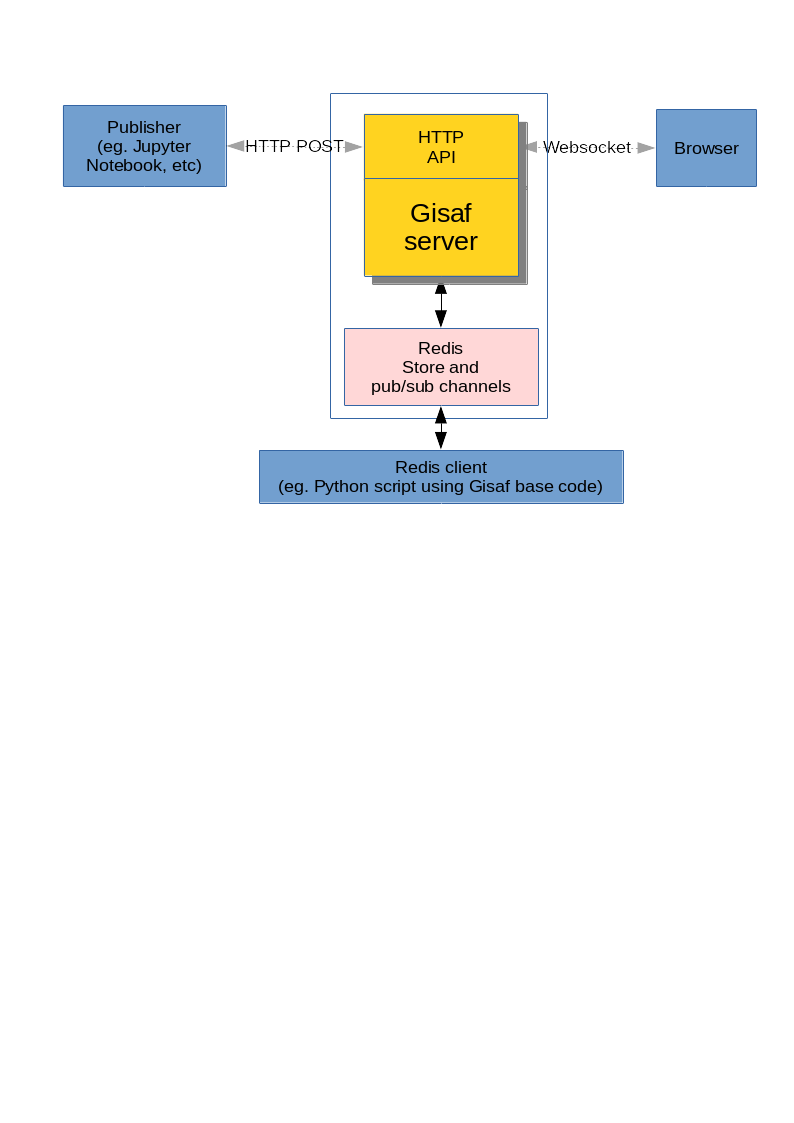
Architecture
Gisaf live layers use a redis data store for:
1. Storage of the live layers
2. Publish/subscribe for live updates.
The live updates are sent through a websocket, initiated by the clients (web browsers).
Moreover, Gisaf exposes an HTTP API for external control of the live layers, eg. by Jupyter notebooks running on another server.
This mode of operation is well adapted for experimenting with GeoPandas and publishing the results directly in the context, with other layers coming from the database.