Support #14542
Gisaf not properly working: time-out and wrong date for weather station rainfall data - UPDATE
0%
Description
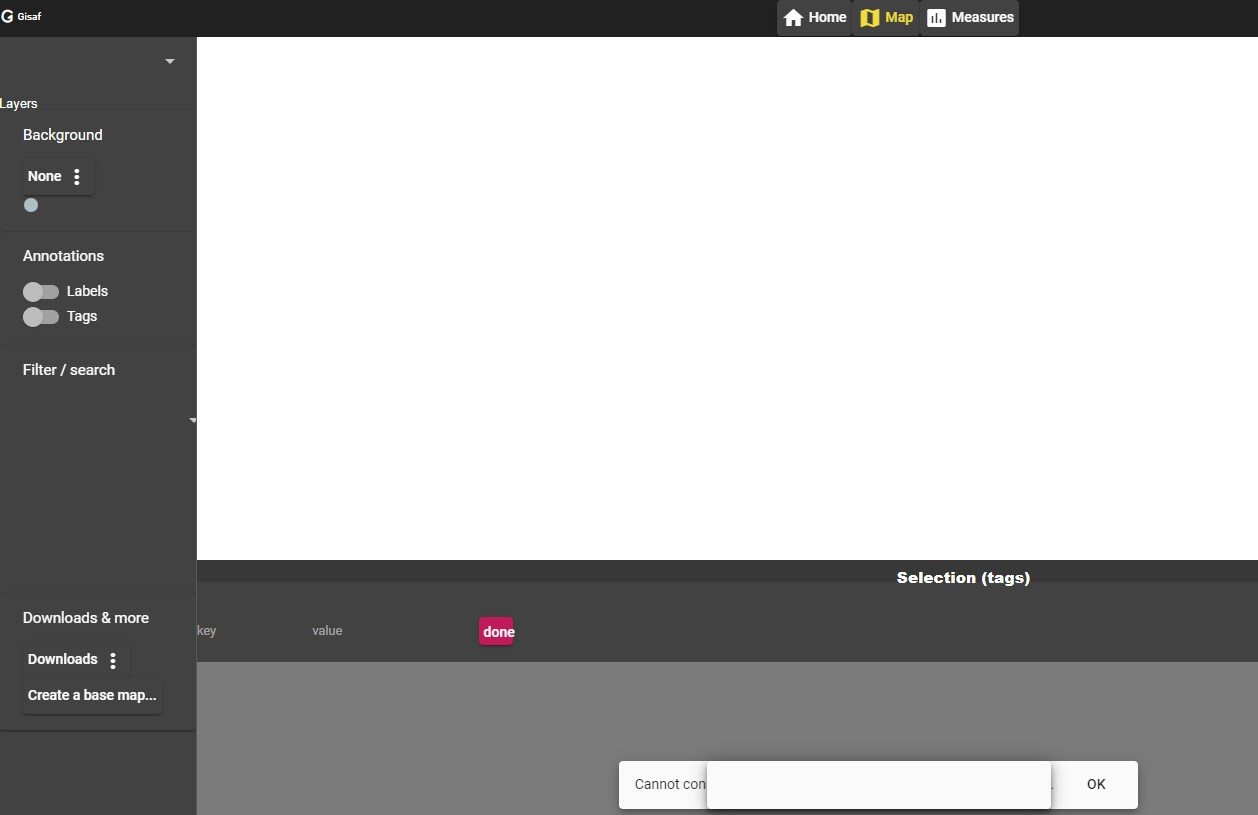
This morning (8th of October 2022) Gisaf was down, but the server was on. I have switched the server off, then waited some time and then restarted the server. I could then connect to Gisaf, and I wanted to check how much rain we got in CSR weather station (as it was raining last night). I saw the value of 24.4 (if I am not wrong), but its date on the graph was wrong, indicating the 9th of october (tomorrow). So, I wanted to download the raw data and see how were they recorded, but I got the "Time out" error, and then Gisaf stopped connecting (see screenshot attached).
I hope you can understand what is happening... thanks for letting me know
Gisaf 8 october 2022.jpg View (45 KB)
Giulio @ CSR (4)-rainfall-D.csv View (35.8 KB)
Wrong date displayed.jpg View (16.1 KB)


History
#1 Updated by Giulio Di Anastasio almost 4 years ago
- Subject changed from Gisaf not properly working: time-out and wrong date for weather station rainfall data to Gisaf not properly working: time-out and wrong date for weather station rainfall data - UPDATE
I could now connect to Gisaf again, even though I did not do anything ...
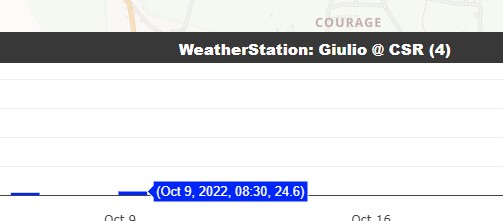
I went to CSR weather station, and checked today rainfall data: it says 24.6, but the displayed date is 8th of october.
I then went to download the daily resampled data, I got the file, and I saw that the 24.6 mm is actually recorded as being on the 8th of october, which is correct: so it looks like we have a discrepancy between the stored data and the graph displayed data...
I also tried to download the raw data of the weather station, but it gave me the error "504 Gateway Time-out" and below it, "nginx"
Thanks
#2 Updated by Giulio Di Anastasio almost 4 years ago
- File Wrong date displayed.jpg View added
- File Giulio @ CSR (4)-rainfall-D.csv View added
I attach here the screenshot of the graph with the wrong date (9 october), and the downloaded daily rainfall csv, with the last reading (today) being correct...
#3 Updated by Philippe May almost 4 years ago
- Status changed from New to In Progress
Hola de Andalucia, taking a few days in this beautiful region... All good but bit hectic with internet connection.
I had a very quick look on the server and everything looks OK right now. The geomatics portal seems also OK, with latest rain data (enjoy the rainfall!).
Checking https://gis.auroville.org.in/dashboard/Water/Weather%20stations: it looks like the 2 weather stations which send data to AmbientWeather.com web service had a cumulative correction of around 20mm at 12AM this night. Kalpana's WS (a different model/brand) sends data to WeatherUnderground.com and seems all good.
So i suspects it's a temporary failure from AmbientWeather.com.
Raw data from CSR WS is huge now, with millions of records. I'll check later when i have better internet and some more time.
#4 Updated by Giulio Di Anastasio almost 4 years ago
Thanks Philippe for looking at it!
I did not understand what you mean by saying "it looks like the 2 weather stations which send data to AmbientWeather.com web service had a cumulative correction of around 20mm at 12AM this night".
Also, please check about the dates in the graphs of CSR and Sunship WS: they look one day ahead (9 october instead of 8, 10 instead of 9, etc)
Thanks
#5 Updated by Philippe May almost 4 years ago
The brand of these 2 WS is AmbientWeather, and they send the data to AmbientWeather.com web/cloud service.
The one in Kalpana is another brand, and there is no option to send data to the same service, so i have configured it to send data to weatherunderground.com, and wrote another piece of software interface to get data from there.
I think the confusion with the day is only with the X axes in the graph. When you get data in CSV or mouse over on the graph, the values look OK to me.