Bug #14894
Well levels Timeline graphs: weekly rainfall data for 2020 not correct
100%
Description
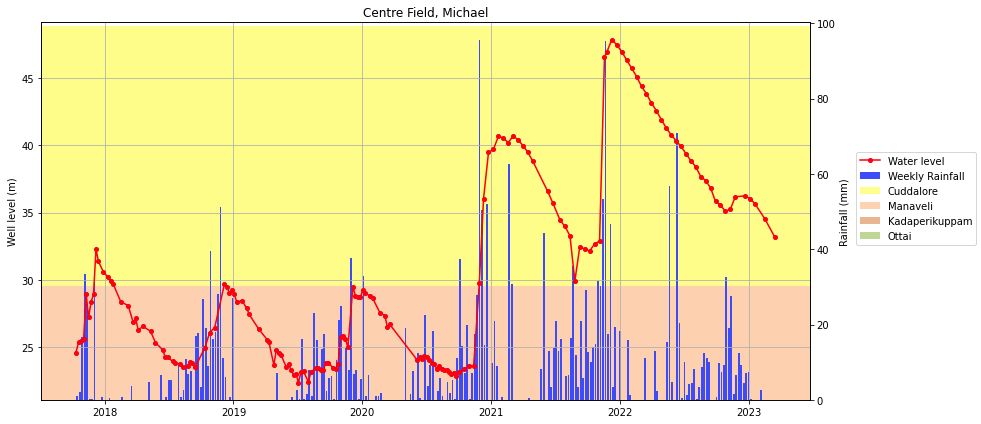
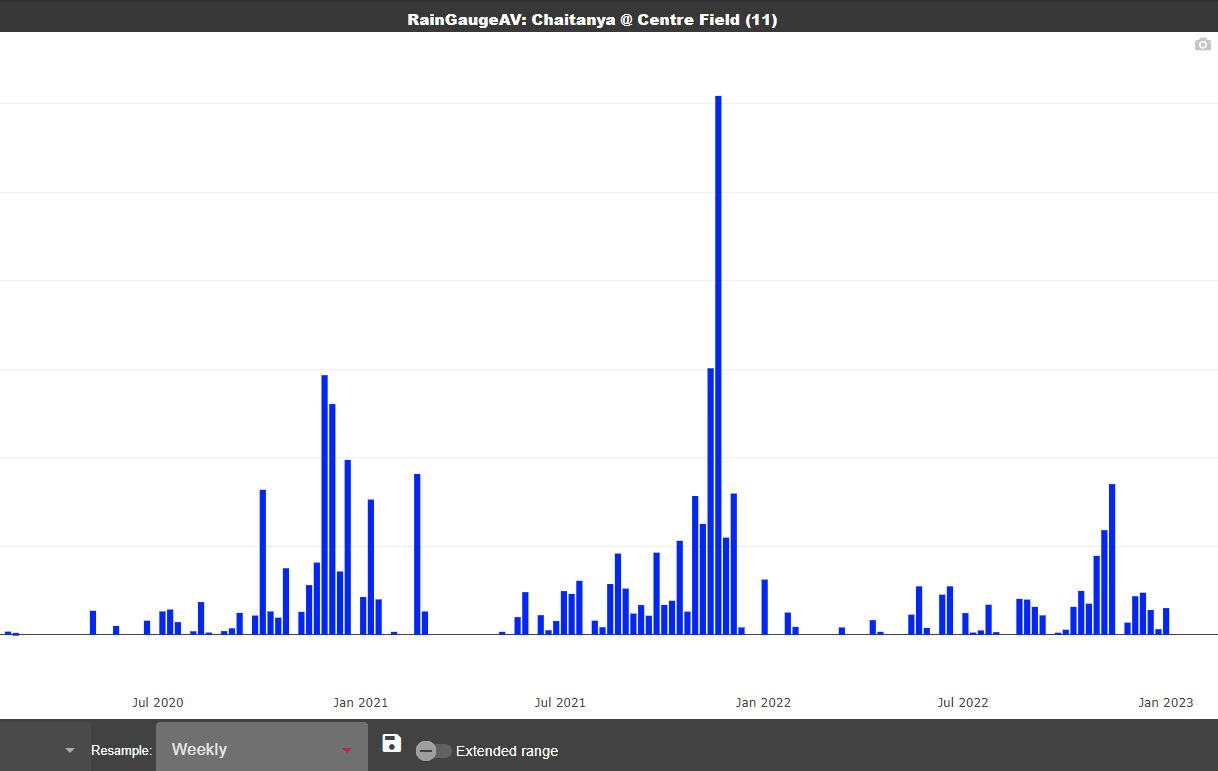
The graph combining weekly rainfall and well water levels in the Dashboard Water/Wells level timeline in the Home page of the website displays wrong values for the year 2020 (and perhaps also for other years): there is in fact at least one value which is very very high, comparable if not identical to the highest rainfall value of 2021: but when you check the weekly rainfall values for the year 2020 of any of the raingauge data there is no such high value...see attached image of the dashboard for the well of Michael Tait in Centre Field (screenshot 1), and the weekly rainfall data from Chaitanya and Pavneet (in Centre Field) (screenshot 4)


Associated revisions
Fixes #14894: aggregation function for rainfall in well timeline
History
#1 Updated by Philippe May over 3 years ago
- Status changed from New to Resolved
Well spotted: there was an issue with the resampling of the raingauge (it used the mean function instead of sum, as it's a cumulative value). The resampling is done with a 1 week samples.
Also remember that the same raingauge (Charlie's, id #2) is used for all wells.
It took 2 years to identify this! ![]()
#2 Updated by Philippe May over 3 years ago
- % Done changed from 0 to 100
Applied in changeset avsm_notebooks|96daf4361cdcabbac031c96adb4b053fdcd71fac.